
I started playing around with ChatGPT’s new data analysis capabilities last week and was amazed at what is now possible.

Note: This requires ChatGPT 4.0 (paid).

To start, I exported my main LeadSimple pipeline (property management owner leads), dropped the CSV into chatGPT, and started asking questions:
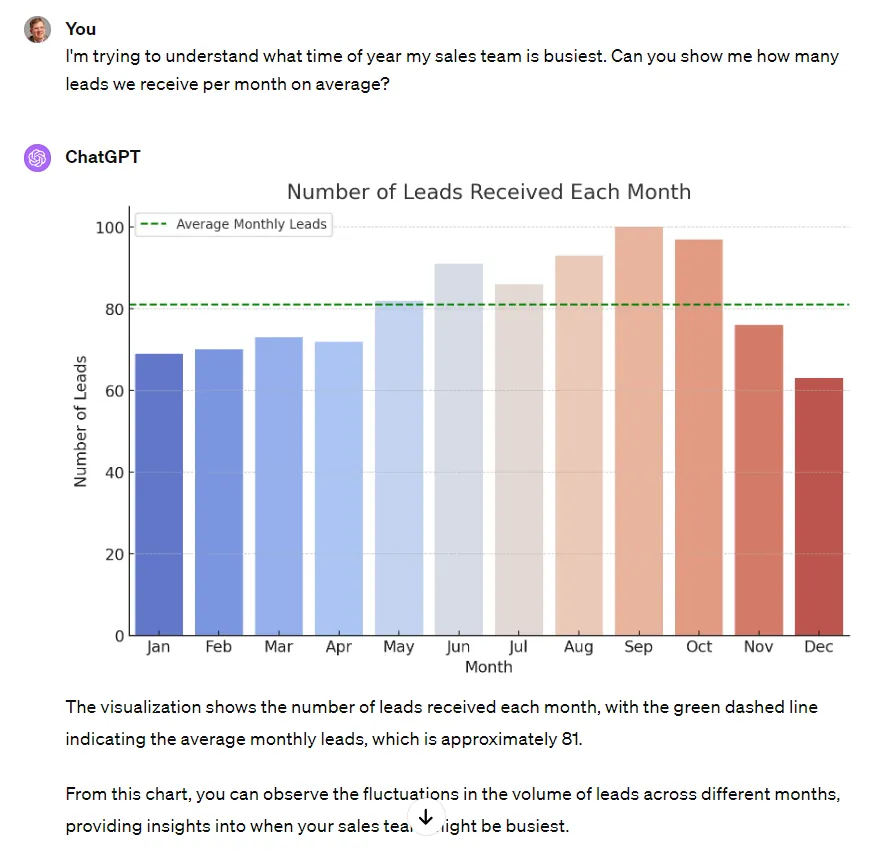
ChatGPT bar chart of owner leads received each month, averaging about 81 a month and peaking in September

Next, I wanted to find out where our leads were coming from:
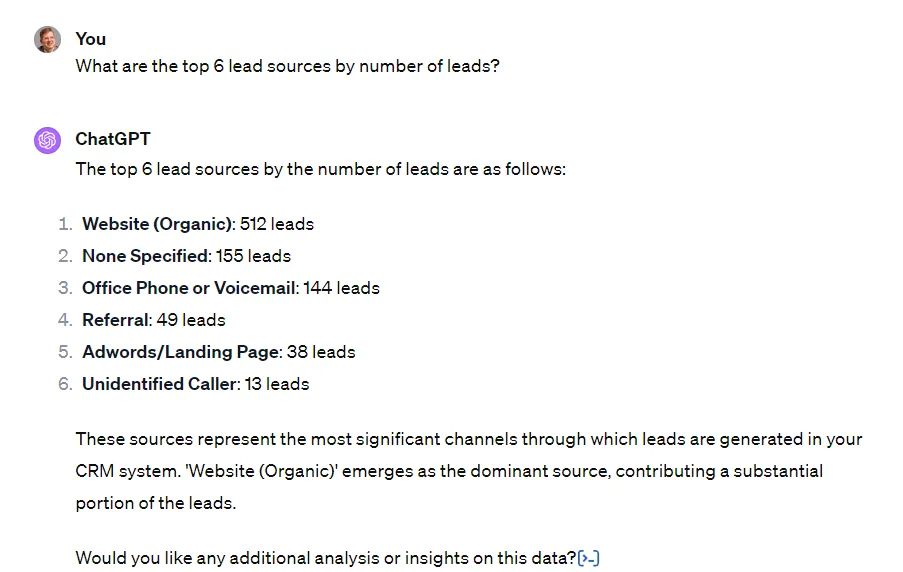
ChatGPT listing the top 6 lead sources by volume: organic website 512 leads, none specified 155, office phone or voicemail 144, referral 49, Adwords landing page 38 and unidentified caller 13

From here I wanted to understand how the closing rate varied by lead source:
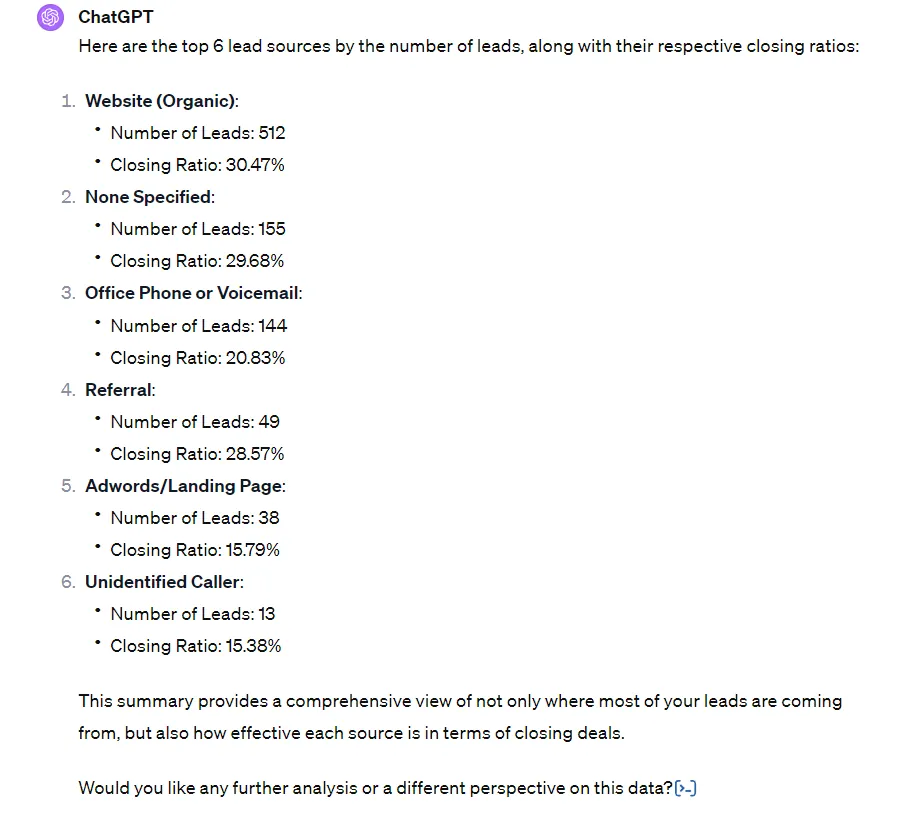
ChatGPT showing closing ratios for the top 6 lead sources: organic website 30.5%, none specified 29.7%, referral 28.6%, office phone or voicemail 20.8%, Adwords 15.8% and unidentified caller 15.4%

And then I decided it would be neat to see this on a graph.
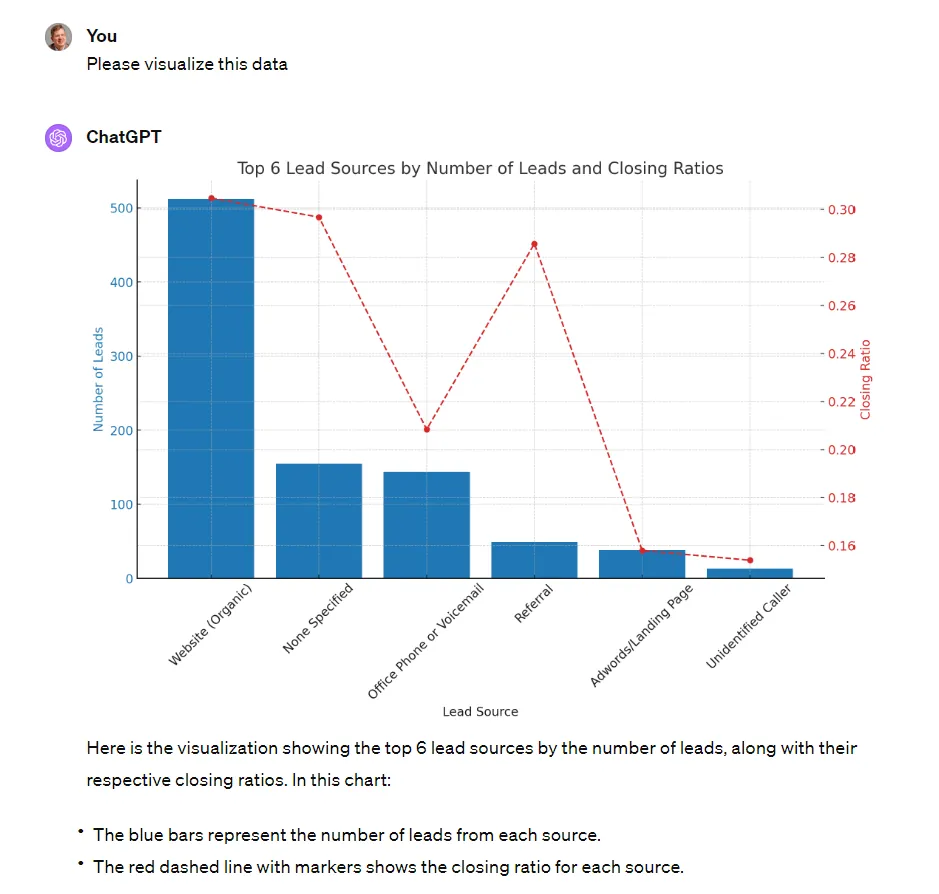
ChatGPT chart combining lead counts and closing ratios for the top 6 lead sources, with organic website leads far ahead in volume

Then I became interested in visualizing our lead flow volume over the last 3 years so I could understand any trends:
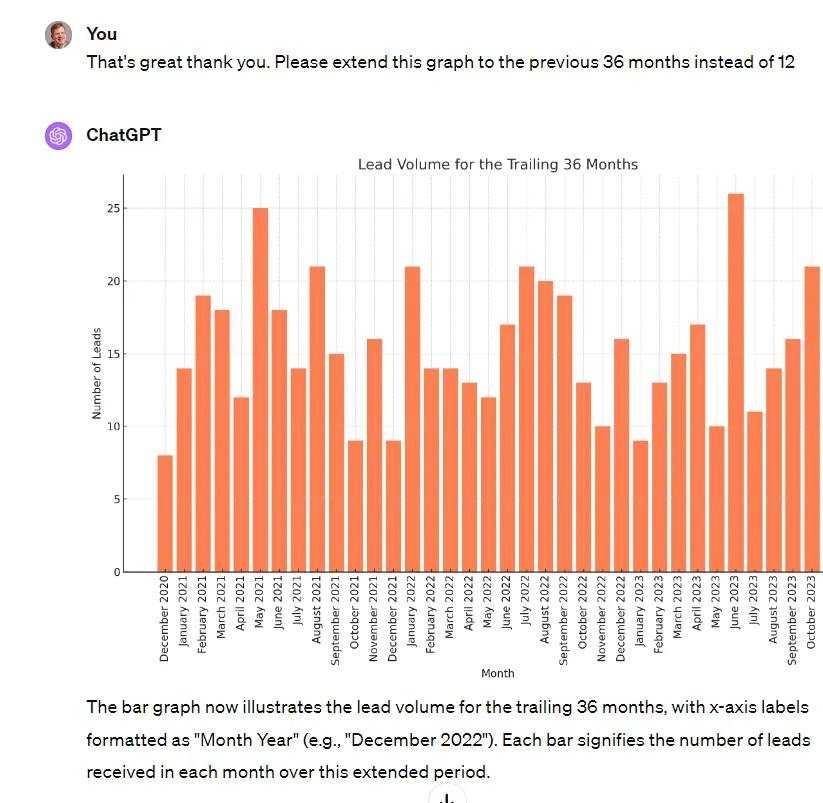
ChatGPT bar chart of monthly owner lead volume over the trailing 36 months, December 2020 to October 2023, ranging from about 8 to 26 leads a month

Then I got curious out if lead flow varied by day of the week. It does, quite a bit:
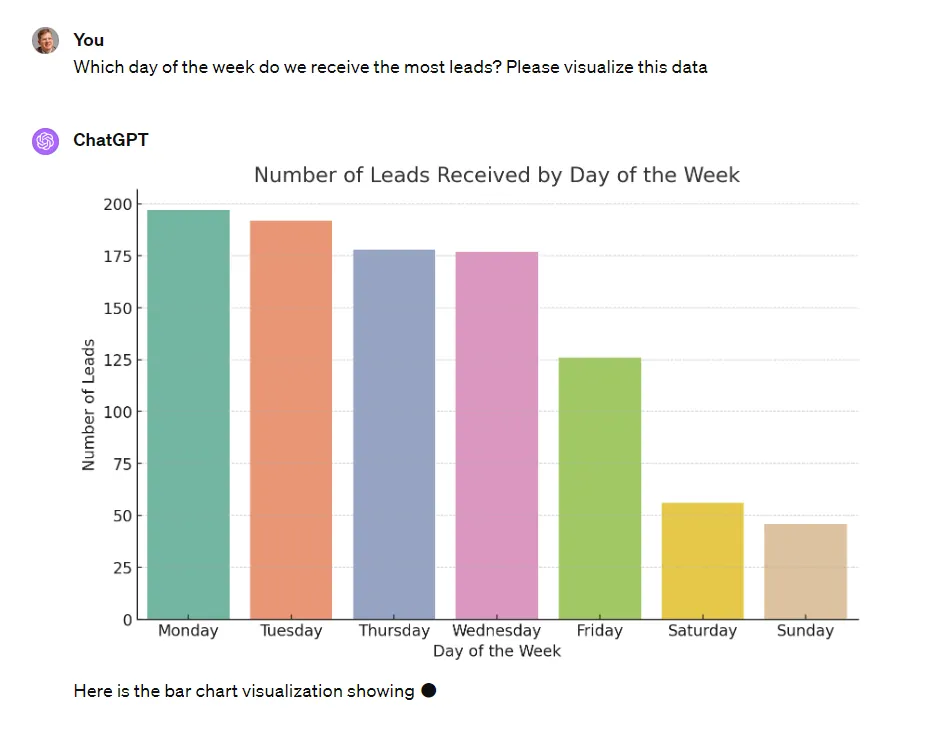
ChatGPT bar chart of leads by day of the week: Monday and Tuesday are busiest at nearly 200 each, and Saturday and Sunday are lowest at about 50

Next I wanted to see any patterns in lead flow by time of day & day of the week:
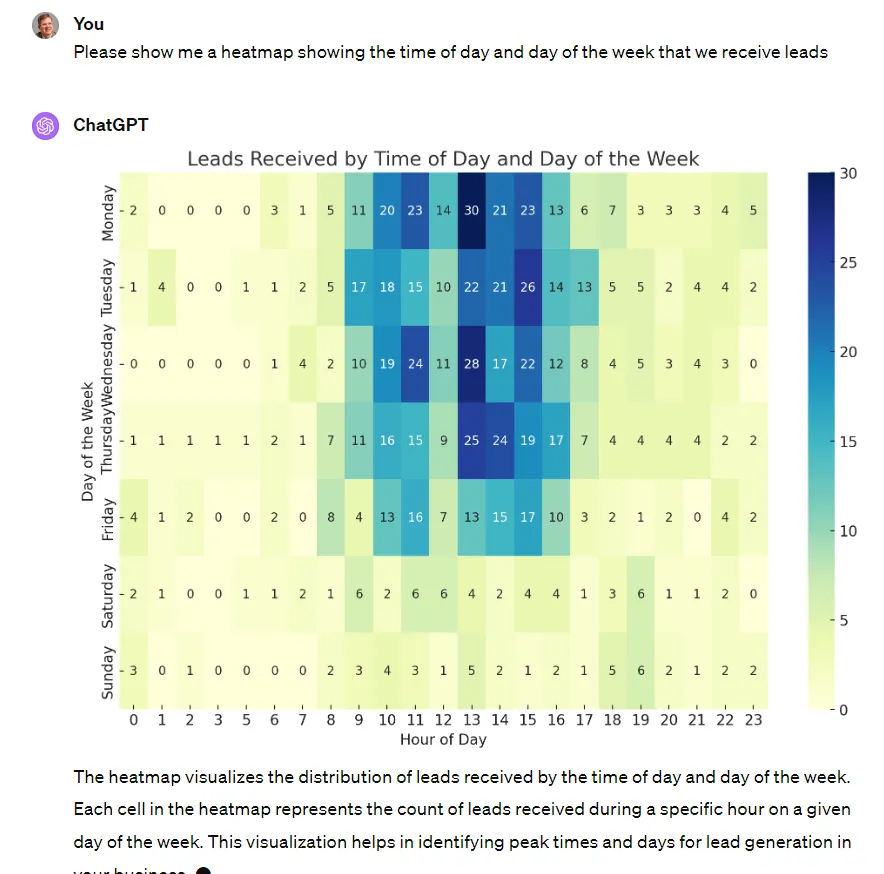
ChatGPT heatmap of leads by hour and day of the week, with most leads arriving between 9 a.m. and 4 p.m. on weekdays

Finally, just for fun, I looked into closing rate by the email domain of leads:
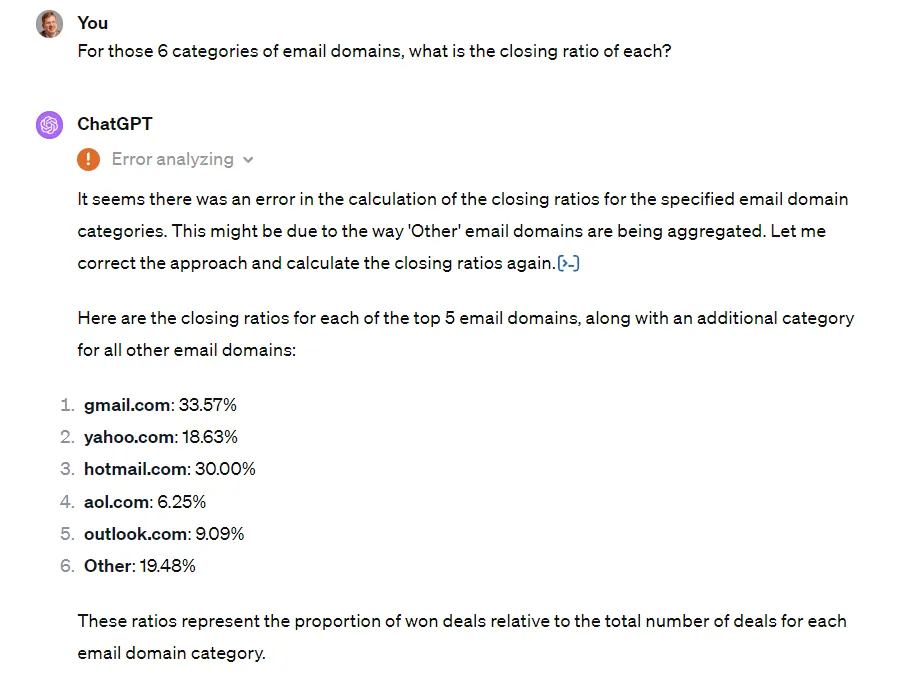
ChatGPT listing closing ratios by lead email domain: gmail.com 33.6%, hotmail.com 30%, other domains 19.5%, yahoo.com 18.6%, outlook.com 9.1% and aol.com 6.3%

So you can see there is a LOT of power here. All of this took me just a few minutes of playing around asking questions.